10 Ways That Tanium Makes Performance Monitoring Better
Product architectures can make a big difference in how efficiently performance data is collected and analyzed
Performance management is the practice of monitoring and managing the performance of computers across an organization to ensure that employees’ work is never compromised by software or hardware problems.
Most performance management products collect performance data from software agents installed on laptops, desktops, servers and other network endpoints. Some collect this data on a server or in a data lake, where it can be analyzed by IT operations engineers. Other products help engineers examine this data directly on endpoints, as well as on servers.
Analyzing endpoint performance data may reveal all sorts of problems, such as:
- Memory leaks resulting from recent software updates
- Misconfigured antivirus software that ends up consuming too much CPU and memory
- Manufacturing flaws in a new shipment of hardware products
- Abnormalities indicating the presence of a security threat
Product architectures can make a big difference in how efficiently that performance data is collected and analyzed. How much data is collected? Is all the data streamed from every endpoint to a central server, potentially increasing network congestion? How intrusive is the monitoring process and the process for remediating problems for end users? Ideally, performance monitoring itself shouldn’t compromise the performance of endpoints or the network, but in the case of some products, it does.
The Tanium solution for performance monitoring
Tanium offers industry-leading performance monitoring as part of its endpoint management services. Unlike traditional performance management products, Tanium Performance Monitoring helps IT organizations monitor and connect to endpoints from any internet connection, rapidly diagnose problems using a wealth of detailed historical data, and fix problems quickly and easily.
Here are 10 ways that the Tanium Performance Monitoring solution, available as part of Tanium Endpoint Management, makes performance monitoring more insightful, accurate and scalable.
1. Tanium monitors endpoint activity 24/7 and stores recent activity on the device to accelerate analysis and troubleshooting.
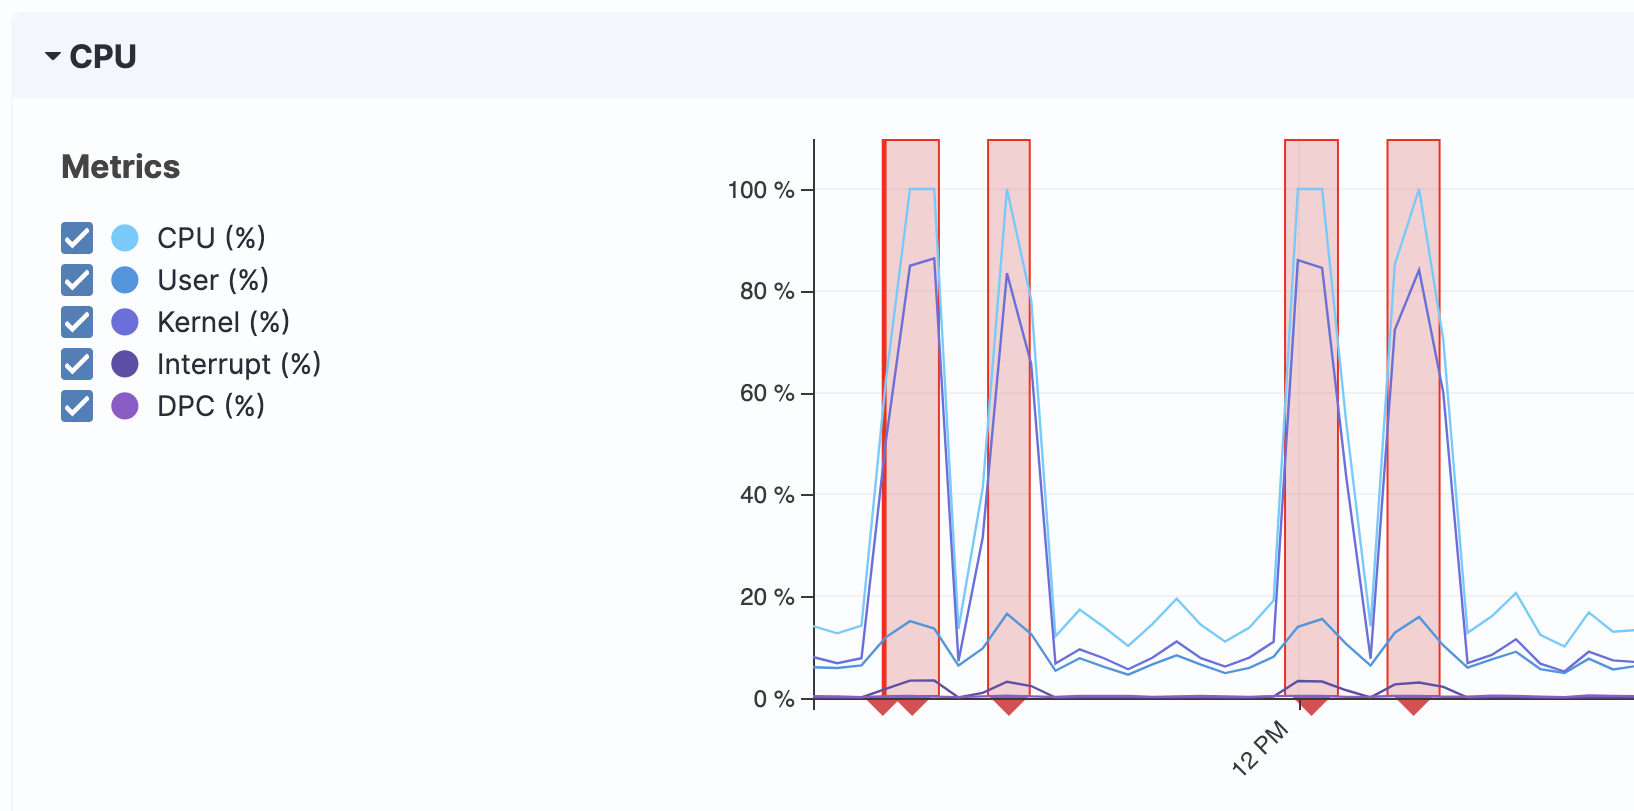
The Tanium client monitors endpoint activity, including active processes, CPU utilization, and memory utilization, and stores this data locally on the endpoint for a configurable length of time. When significant performance problems occur, the endpoint notifies the Tanium Platform, raising an alert for the IT organizations.
Because it stores performance data locally, Tanium enables engineers who connect to the endpoint to find a rich trove of historical data about the endpoint’s activity and potential problems. Using this data, engineers can more quickly determine the source of problems and how they can be fixed.

Tanium can monitor endpoint activity
2. As part of the Tanium Platform, which typically discovers 10-20% more active endpoints than other endpoint management solutions, Tanium Performance Monitoring provides proactive monitoring data for endpoints that other platforms miss.
Because it’s part of the Tanium Platform, Tanium Performance Monitoring benefits from the superior endpoint discovery capabilities of the platform itself. When installed on an enterprise network, Tanium typically discovers hundreds or even thousands of endpoints that other endpoint management solutions overlook. Through Tanium, IT organizations gain greater visibility into all their endpoints for all management use cases, including performance management.
3. Tanium monitors Windows, macOS, and Linux endpoints, providing a single, comprehensive solution.
By monitoring the performance of all these types of endpoints, Tanium saves IT organizations the trouble and expense of deploying multiple monitoring products simply to monitor different types of endpoints. Consolidating monitoring systems also makes it easier to discover problems that might affect multiple types of endpoints simultaneously.
4. Tanium provides a view of “fleet health,” helping operations engineers to see at a glance how well endpoints perform across even the largest organizations.
In addition to providing performance management insights about specific endpoints, Tanium provides a broad view of all endpoints under management and reports valuable metrics, such as the percentage of endpoints with critical performance events.
The Tanium Performance Monitoring solution scales to support monitoring and managing hundreds of thousands of endpoints.
5. Tanium provides help desk engineers and other IT staff with instant access to endpoints without the need for cumbersome remote support agents and processes that interrupt an employee’s work in progress.
Detecting performance problems is just part of any process for optimizing endpoint performance. Often, a help desk engineer or some other member of the IT team will need to connect to the endpoint, assess the problem, and make configuration changes, such as installing software updates, to resolve it.
With many performance management products, this kind of intervention can be intrusive to employees. They might be asked to stop their current work — no matter how important it is — and install a special client or interact with a dialog box to give a remote engineer access to their endpoint. The performance problem might eventually be resolved, but the repair process might end up being as disruptive to the employee’s day as the original performance problem itself was.
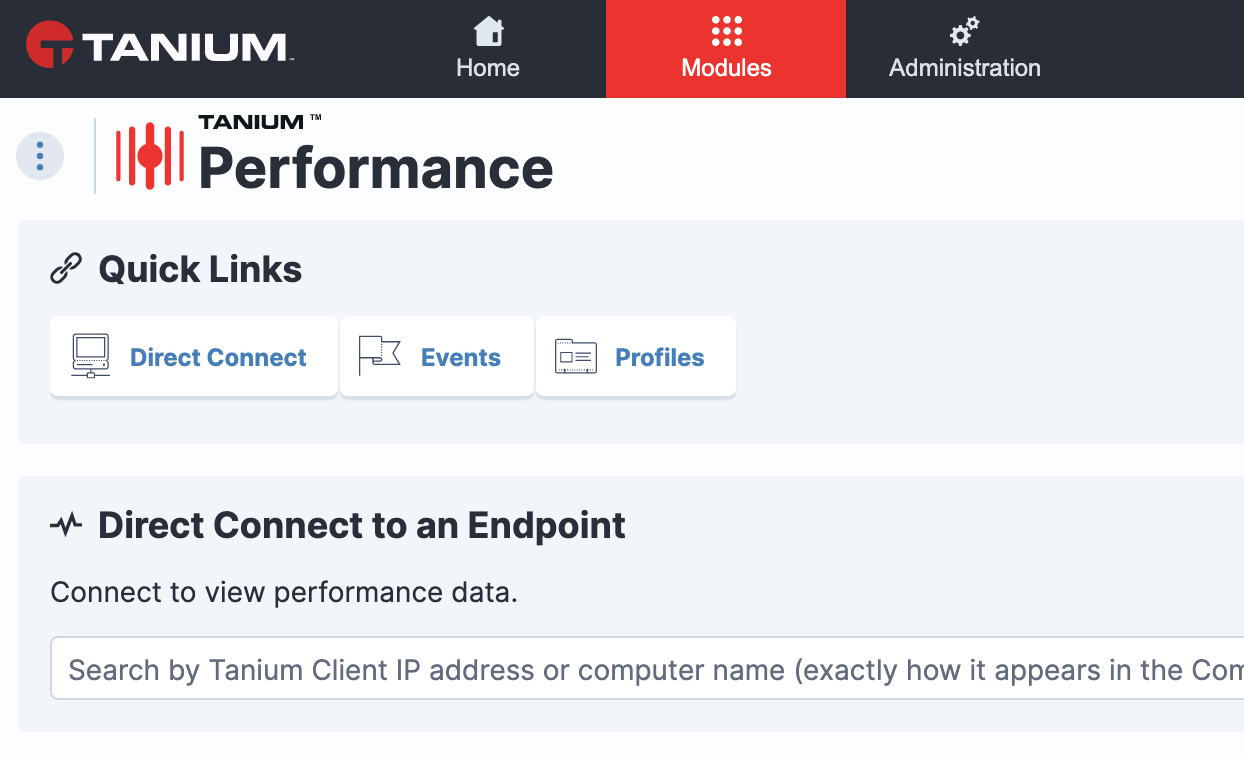
In contrast, Tanium makes it easy for engineers to connect directly to an endpoint, perform assessments, and make changes without requiring any action by the employee at all. This direct access makes it easier for engineers to diagnose intermittent problems since they can explore problems while they’re still occurring. It also leads to faster problem resolution, fewer interruptions of employees’ workdays, and improved employee productivity.

Tanium makes it simple to direct connect to any endpoint
6. Tanium provides real-time visibility into the performance of remote endpoints without requiring a VPN connection.
Many traditional endpoint management tools were built for what is now a bygone era: the time when nearly all endpoints were on an internal network protected by a corporate firewall and in continual communication with local IT monitoring services.
Now that most employees work from home, that ready access to local, continuously connected endpoints has disappeared. Some IT management solutions require a VPN connection to establish a trusted connection for monitoring and managing endpoints. Tanium doesn’t. With Tanium, IT engineers can manage endpoints over conventional internet connections, removing the need for costly VPN access.
Now that most companies have shifted to a remote workforce indefinitely, it’s important for organizations to be able to manage endpoint performance without requiring VPN access.
7. Tanium provides detailed information about endpoints, aiding rapid resolution of problems.
Tanium endpoint management provides not just data about current and recent process execution but also endpoint data such as CPU model, memory capacity, and other hardware characteristics that can aid in troubleshooting elusive problems.
Some software problems might manifest only in certain hardware configurations. By providing detailed data about both software and hardware, Tanium helps organizations troubleshoot these problems quickly.
8. Tanium helps diagnose problems with internally developed applications.
By detecting endpoint performance problems associated with software releases, Tanium helps internal development teams discover potential problems such as memory leaks or other bugs that might not have been detected in the testing phase of development.
9. By reporting on performance trends and endpoint usage, Tanium helps IT organizations with capacity planning and budgeting.
Tanium Performance Monitoring provides the reporting and trend analysis that IT leaders need for determining if endpoints and networks currently deployed meet the needs of employees.
By tracking important details such as hardware models and configurations, application health, system health, CPU utilization, and more, Tanium makes it easier for IT organizations to make informed decisions about provisioning new hardware and software to meet staffing requirements and support business goals.
10. Tanium reduces Mean Time to Repair (MTTR) times compared to other performance management products.
Tanium accelerates the important work of fixing performance problems on endpoints. It gives IT engineers visibility into endpoint performance and performance trends. This enables IT engineers to quickly and easily connect to endpoints, wherever they are, examine their recent and historical performance data, and make changes directly, minimizing employees’ daily work.
The direct access provided by Tanium enables help desk engineers to investigate problems as soon as tickets are opened. And when engineers connect to endpoints, they’ll find a wealth of information to work with, including historical data that helps with diagnosis of intermittent or cyclical problems.
In all, Tanium provides faster access, more detailed data, and more granular controls for ensuring that endpoints of any operating system perform optimally, promoting rather than jeopardizing employee productivity.
Trust Tanium for Endpoint Management
Enterprises need a fast, efficient, and cost-effective solution for monitoring and managing performance endpoints wherever they are: on an internal network, in a remote location like a home office or in the cloud.
Tanium Endpoint Management provides the performance monitoring solution that enterprises need to keep their flexible workforces productive and secure. Featuring a highly efficient linear-chain network design and granular controls, Tanium gives IT organizations the speed and flexibility they need for optimizing endpoint performance and security at any location, anytime.
Learn more about the Tanium Performance Monitoring solution and request a demo today.
You can also read my other blog post, 7 Best Practices for Endpoint Performance Monitoring.


