7 Best Practices for Endpoint Performance Monitoring
Follow these best practices, and you’ll optimize performance without disrupting employees’ daily work and benefit from faster response to security vulnerabilities and other operational risks
The productivity of any organization depends on the performance of its employees’ computers.
If those computers run slowly or crash, employee productivity will suffer and overall agility of the organization will decline.
With so much at risk, performance monitoring is a critical capability for any organization interested in making the most of its people and technology.
Here are seven best practices for ensuring your organization monitors the performance of employee computers, servers and other endpoint devices effectively and efficiently.
1. Monitor every type of endpoint
It’s tempting to keep things simple. Let’s say that 90 percent of the endpoints in your organization are Windows machines. You invest in tools and set up processes for monitoring those Windows machines.
Sure, there are Linux servers, but they’re not in people’s cubicles or home offices. And some of the executives love their Macs. You’re going to trust that those machines work well; after all, no one’s complaining. And you’ve got lots of charts to show what a great job you’re doing with the Windows machines.
But those other endpoints matter, too. And when they have performance problems, they can affect large numbers of other users, directly or indirectly. (When the CFO’s Mac crashes, and he or she can’t approve purchases, a lot of people will feel the pain.)
So one way or another, make sure you have tools and processes in place for monitoring every type of endpoint in your organization: Windows, macOS and Linux.

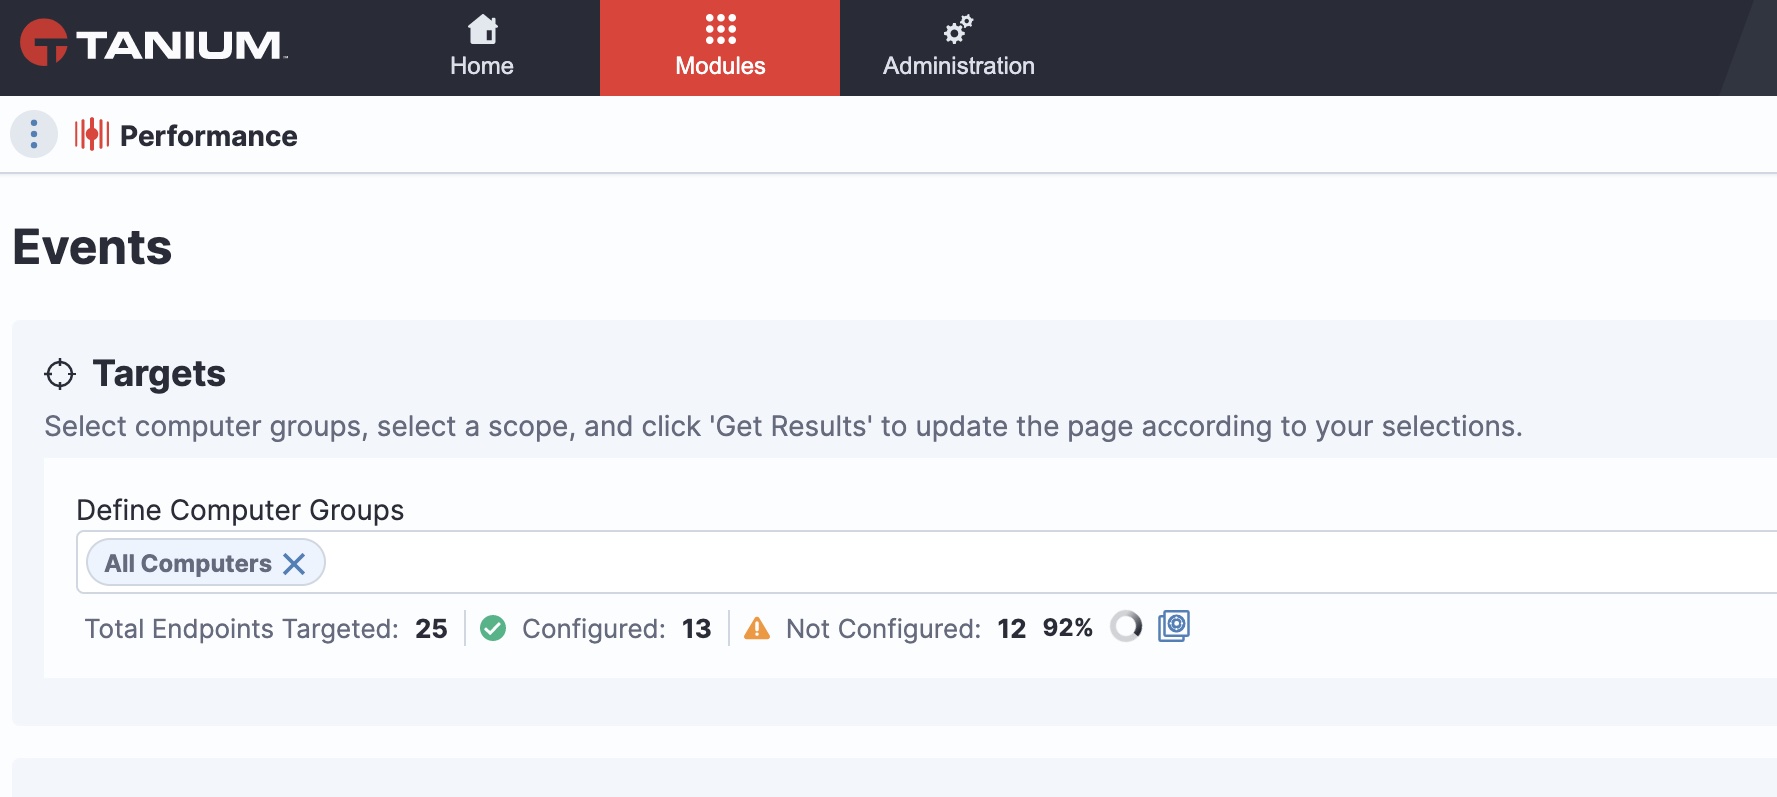
Investigate endpoint data from the Tanium console
2. Monitor every endpoint (yes, every endpoint)
Even if you have monitoring tools for every type of endpoint in your organization, chances are you still overlook some — or a lot — of your endpoints. I say that because when we visit companies to assess their performance monitoring practices, we typically find that about 10-20 percent of endpoints are left out of performance monitoring reports.
That means that 10-20 percent of endpoints are at risk of delivering poor performance, leading to employees using those endpoints becoming frustrated and less productive.
One way or another, set up tools and processes to ensure you can really monitor every endpoint in your organization.
3. Get the big picture
Finding every endpoint is one thing. Letting IT and business unit leaders get a “fleet view” of all endpoints under management is another thing.
Effective performance monitoring often requires the big picture — the dashboard view that lets you see that the Chicago office, say, is doing fine, but that Cincinnati has endpoints crashing because of memory errors following last night’s application upgrade.
To monitor performance across the enterprise, make sure you can get an enterprise-wide view, as well as a close-up on any endpoints experiencing performance issues.
4. Keep it simple for end users
In many organizations, when an employee reports a performance problem to the help desk, the interruptions to that employee’s work are just beginning. Most performance monitoring platforms require IT engineers to interrupt or compete with the employee’s work to troubleshoot the problem.
The employee might have to accept a request for installing a new diagnostic or remote control application on their endpoint. Investigating the problem might not be able to begin until official work — progress as part of the employee’s job — stops. If the problem was intermittent, resulting from whatever activity the employee was engaged in, the optimal opportunity for troubleshooting has been lost.
A better approach? Use tools that allow engineers to investigate what’s happening on the endpoint without interrupting the user. Let engineers inspect processes, memory usage, and other key data without requiring the employee to lift a finger, install a client, click through dialog boxes, or spend an hour on the phone.

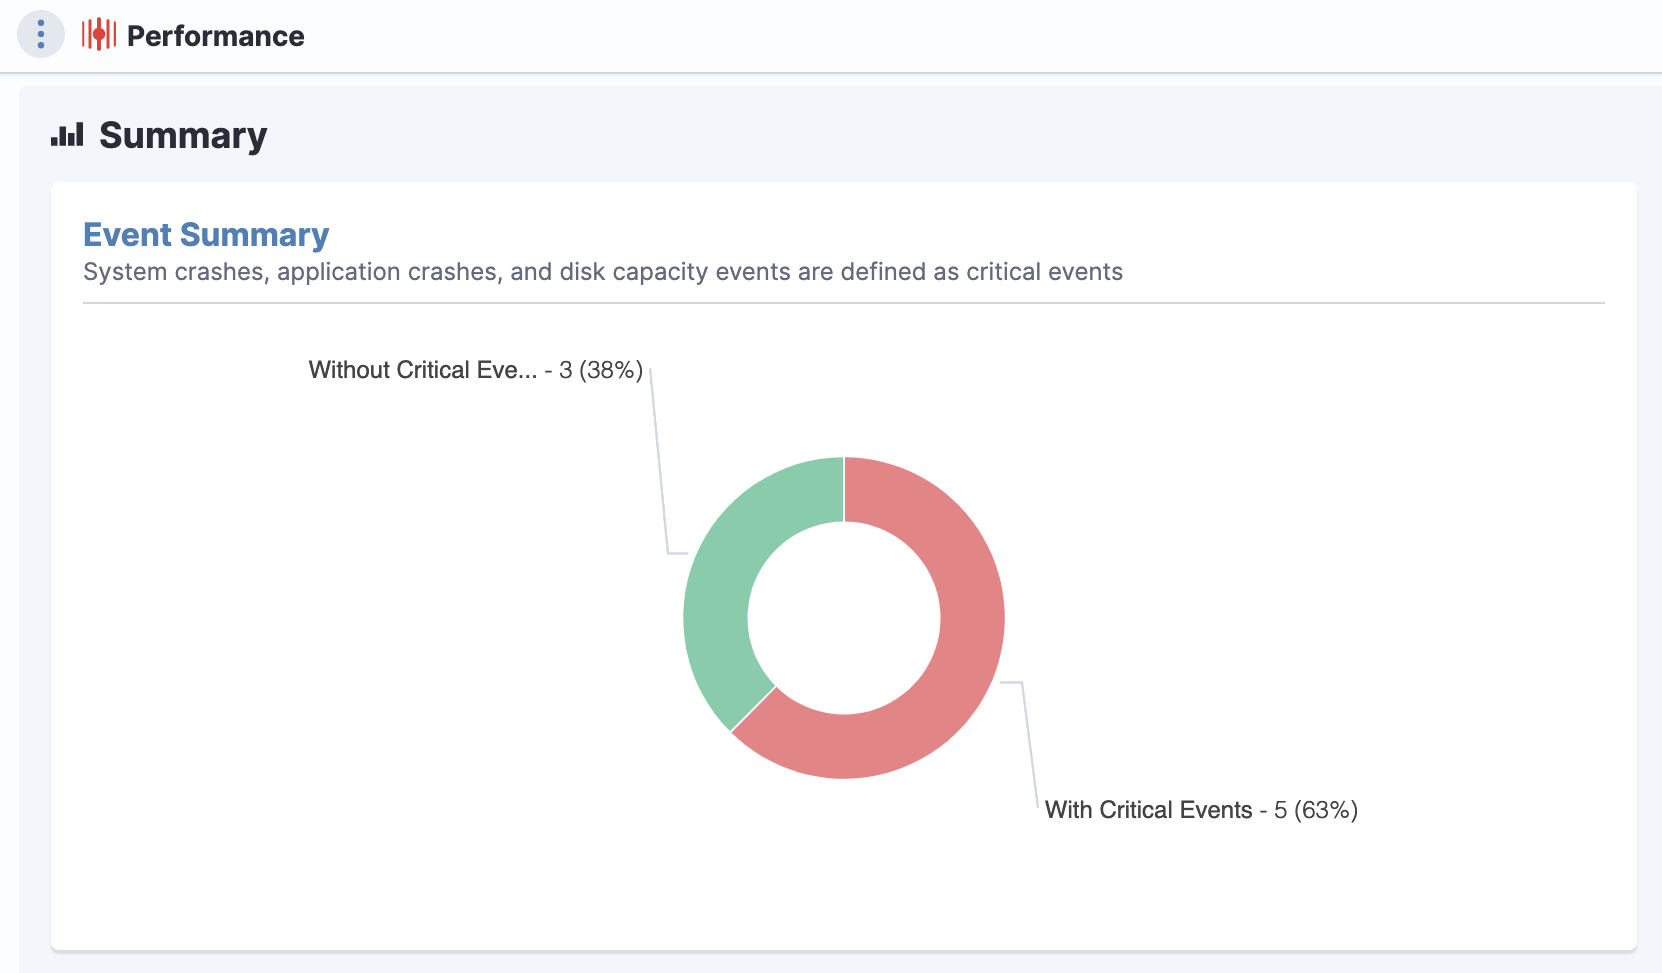
Fix issues with speed
5. Record locally, troubleshoot globally
One reason why so many performance-monitoring platforms rely on intrusive investigation techniques is that they have little or no access to data about endpoint activity until engineers actually connect to endpoints over the network.
This approach has two major shortcomings: it interrupts users, and it limits the data that engineers can access. If a problem is intermittent or somehow associated with other activity that occurred over hours or days beforehand, the investigating engineer will likely miss these insights.
An alternative approach is to have endpoints record performance data locally so that when engineers investigate problems, they can immediately find a wealth of data to work from in a local data store.
Because the data has already been collected, engineers don’t have to interrupt users to collect it. And because data is stored locally, engineers can access the data without requiring all endpoints to continuously stream detailed metrics to a central management console.
Yet even without a colossal, traffic-congesting collection of data over networks, engineers can troubleshoot the endpoint from any location: a local LAN or WAN, a Help Desk center, a Security Operations Control center, or even a home office.
The result is better information for troubleshooting, faster resolution of problems and more convenient interactions for both end users and engineers.
6. Help the in-house dev team
By collecting and sharing detailed information about endpoint performance, an IT operations team has the opportunity to help the in-house development team troubleshoot the applications they’re developing for employees.
Live and historical performance data about process execution, memory allocation, disk usage, and other key metrics across hundreds or thousands of endpoints can help developers troubleshoot and correct problems they couldn’t detect or properly characterize in more limited rollouts in test environments.

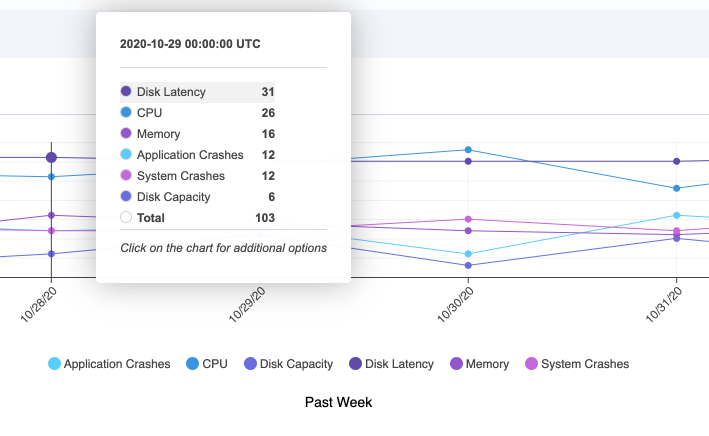
Live and historical performance data
Performance monitoring might be thought of as a general tool applicable to every employee, but it’s also a valuable tool for development organizations — even if it’s not officially part of a software development suite.
7. Shrink Mean Time to Repair (MTTR)
MTTR is perhaps the ultimate measure of any performance monitoring practice.
When a problem occurs, how quickly can the IT team resolve it? Can they find the information they need quickly and easily? Can they find it without interrupting the employees affected by the problem?
Tracking metrics like these enables IT organizations to assess the value of their performance tools and procedures. If the people, processes and technology you use for performance monitoring don’t shrink MTTR, that’s an indication that your people, processes and technology still need help.
Follow these best practices, and you’ll reduce MTTR, optimize performance without disrupting employees’ daily work, help internal development teams more quickly resolve subtle problems, and benefit from faster response to security vulnerabilities and other operational risks.
To learn more, check out my previous blog post 10 Ways That Tanium Makes Performance Monitoring Better.
If you’re ready to see it in action, sign up for a demo today.


